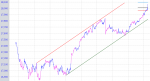
This is the 15min chart of Nifty, if you see here we have drawn two 100% parallel lines. And interestingly, you can see whenever Nifty is touching any of these lines, its reversing its direction. Such parallel lines are called Channels in Chart Analysis. The magical thing in chart analysis is that you can see many such channels in many different stock graphs. However drawing such channels need some experience.